The Complete Procurement Benchmarking Guide: Industry Standards, KPIs & How to Measure Up
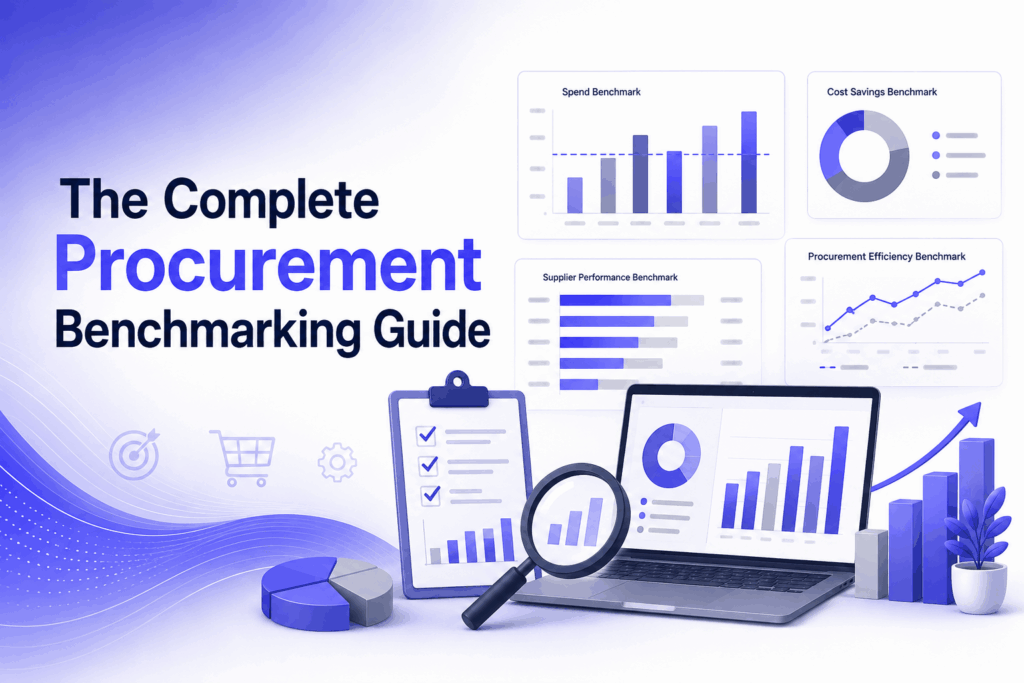
Procurement benchmarking is defined as the structured process of comparing your procurement function’s costs, KPIs, and practices against industry standards or peer organizations to identify performance gaps. It answers one core question: how does your procurement team measure up against proven procurement benchmarks in your industry, and where should you focus improvement first.
Key Takeaways: Procurement Benchmarking Quick Facts
- Procurement benchmarking compares cost, cycle time, compliance, and savings metrics against verified procurement industry benchmarks, not internal opinion.
- McKinsey & Company (2025) found that spend managed per procurement full-time employee is 50 percent higher today than it was five years ago.
- McKinsey & Company (2026) found that most procurement functions use less than 20 percent of the data available to them for decision-making.
- Robert Half (2026) reports a midpoint base salary of $114,750 for a Procurement Manager, a key input for staffing and cost benchmarks.
- A procurement benchmarking report typically covers four categories: cost efficiency, cycle time, supplier performance, and compliance or risk.
- Owl Labs (2024) found that 27 percent of employees now work in hybrid arrangements, a shift that is changing how procurement teams collect and validate benchmarking data across locations.
What Is Procurement Benchmarking?
Procurement benchmarking is defined as the practice of measuring procurement performance data, such as cost savings, cycle times, and supplier compliance, against external procurement benchmarks from peer companies, industry associations, or research firms. The goal is to identify measurable performance gaps and prioritize improvement actions rather than guess at what “good” looks like.
Unlike a one-time audit, procurement benchmarking is meant to be repeated on a regular cadence, typically quarterly or annually, so a company can track whether its procurement function is closing the gap with top performers or falling further behind.
What Is the Difference Between Procurement Benchmarks and Procurement KPIs?
The difference between procurement benchmarks and procurement KPIs is that KPIs are the internal metrics a team tracks over time, while benchmarks are the external reference points used to judge whether those KPI results are strong, average, or weak compared to the broader market.
| Element | Procurement KPI | Procurement Benchmark |
|---|---|---|
| Purpose | Tracks internal performance over time | Compares performance against external peers |
| Source | Generated from internal ERP or P2P data | Published by research firms, associations, or reports |
| Example | Cost savings realized this quarter | Average cost savings realized by top-quartile peers |
| Frequency | Monitored monthly or quarterly | Refreshed annually as new reports are published |
What Are the Core Types of Procurement Benchmarking?
The core types of procurement benchmarking are cost, process, compensation, and technology benchmarking, and most mature procurement organizations track all four together rather than focusing on cost alone. Here are the top four types of procurement benchmarking most organizations use, according to procurement research bodies such as McKinsey and APQC:
- Cost benchmarking, comparing unit costs, cost savings percentages, and total cost of ownership against industry norms.
- Process benchmarking, comparing cycle times such as requisition-to-order and order-to-pay against peer averages.
- Compensation and staffing benchmarking, comparing procurement salaries, headcount ratios, and spend managed per employee.
- Technology benchmarking, comparing adoption rates of e-sourcing, e-procurement, and AI-enabled procurement tools.
What Do Procurement Industry Benchmarks Show About Performance Today?
Procurement industry benchmarks in 2025 and 2026 show a widening gap between digitally mature procurement functions and those still relying on manual processes, with data utilization, spend managed per employee, and generative AI adoption emerging as the clearest dividing lines between leaders and laggards.
- According to McKinsey & Company (2025), the procurement function’s spending managed per full-time equivalent employee is 50 percent higher today than it was five years ago.
- According to McKinsey & Company (2026), today’s procurement functions use less than 20 percent of the data available to them to support decision-making.
- According to McKinsey & Company (2025), 40 percent of procurement functions have implemented or piloted generative AI tools, while procure-to-pay system adoption remains at 60 percent for large organizations and only 30 percent for small organizations.
- According to Robert Half (2026), the midpoint base salary for a Procurement Manager in the United States is $114,750, with a typical range of $84,000 to $129,250.
- According to Owl Labs (2024), 27 percent of employees now work in hybrid arrangements and 11 percent work fully remote, both up year over year, which directly affects how distributed procurement teams gather and standardize benchmarking data.
What Are the Top Procurement KPIs Used in a Procurement Benchmarking Report?
A procurement benchmarking report typically tracks cost savings percentage, purchase order cycle time, supplier on-time delivery rate, contract compliance rate, spend under management, and procurement ROI. These KPIs give leadership a consistent scorecard to compare against published procurement industry benchmarks year over year.
- Cost savings percentage: total dollars saved divided by total addressable spend.
- Cycle time: average days from requisition to purchase order approval.
- Spend under management: percentage of total company spend actively managed by procurement.
- Supplier on-time delivery rate: percentage of orders fulfilled by the agreed date.
- Contract compliance rate: percentage of spend that flows through approved, negotiated contracts.
- Procurement ROI: savings and value delivered relative to the cost of running the procurement function.
How Do Compensation and Staffing Benchmarks Fit Into Procurement Benchmarking?
Compensation and staffing benchmarks matter because procurement’s own operating cost is itself measured against procurement benchmarks, usually expressed as a percentage of total spend under management. Robert Half’s 2026 salary data for Procurement Managers and Procurement Specialists gives finance and HR teams a defensible reference point when building headcount plans or justifying new hires.
What Are the Procurement Best Practices Benchmarks Top Performers Follow?
Procurement best practices benchmarks describe the specific behaviors, not just the results, of top-performing procurement organizations. Research from McKinsey and APQC consistently shows that top performers centralize spend data, automate low-value transactional work, and tie procurement KPIs directly to enterprise financial goals rather than tracking metrics in isolation.
Here are the top five procurement best practices benchmarks used to separate leading procurement organizations from average ones.
- Consolidate spend data into a single source of truth before comparing it against any external procurement benchmarks.
- Automate transactional purchase-to-pay activity so category managers can focus on supplier strategy and negotiation.
- Tie every procurement KPI to a business outcome, such as working capital, margin, or supply continuity.
- Re-benchmark annually using a current procurement benchmarking report rather than reusing outdated figures.
- Build supplier diversity and risk management into core scorecards, not as a separate side initiative.
How Do You Build a Procurement Benchmarking Report Step by Step?
Building a procurement benchmarking report follows five repeatable steps: define the KPIs to measure, pull clean internal data, select a credible external benchmark source, calculate the performance gap, and assign an owner and timeline to close that gap. Most procurement teams repeat this cycle annually so the report stays current.
- Define which procurement KPIs matter most to your industry and spend profile.
- Pull accurate internal data from your ERP, P2P, or spend analytics platform.
- Select a credible external source, such as McKinsey, Robert Half, or a category-specific industry association.
- Calculate the gap between your internal KPI and the published benchmark.
- Assign an owner, a target date, and a corrective action plan for every KPI below benchmark.
What Procurement Benchmarking Challenges Should You Watch For?
The most common procurement benchmarking challenges are comparing against the wrong peer group, using stale data, and mixing internal KPI definitions with external benchmark definitions that measure something slightly different. Any one of these mistakes can produce a benchmarking report that looks precise but leads to the wrong conclusion.
A useful illustrative example: a mid-market manufacturer with roughly $300 million in annual spend compared its cost savings against a benchmark built from Fortune 500 companies, and the comparison made its team look like it was underperforming. Once it re-benchmarked against similarly sized peers using consistent KPI definitions, its procurement function was confirmed to be performing at or above expectations for its peer group. The lesson: a procurement benchmarking report is only as useful as the comparability of the peer group behind it.
Conclusion: Turning Procurement Benchmarks Into Action
Procurement benchmarking works best as a repeatable cycle: define the right KPIs, compare them against credible procurement industry benchmarks like those from McKinsey and Robert Half, and assign clear ownership to close every gap you find. The three points to remember are that benchmarks and KPIs serve different purposes, peer group comparability determines whether a procurement benchmarking report is trustworthy, and supplier diversity now belongs on the same scorecard as cost and cycle time.
If your organization needs help strengthening supplier diversity as part of your procurement benchmarking strategy, contact STARS today to discuss your supplier diversity program needs.
Help Center
Frequently asked questions

Marketing professional passionate about people, creativity, and meaningful growth. Proud to be part of the STARS team, empowering businesses to discover and manage diverse suppliers through one powerful platform.