Five Procurement Dashboards Every Chief Procurement Officer Needs
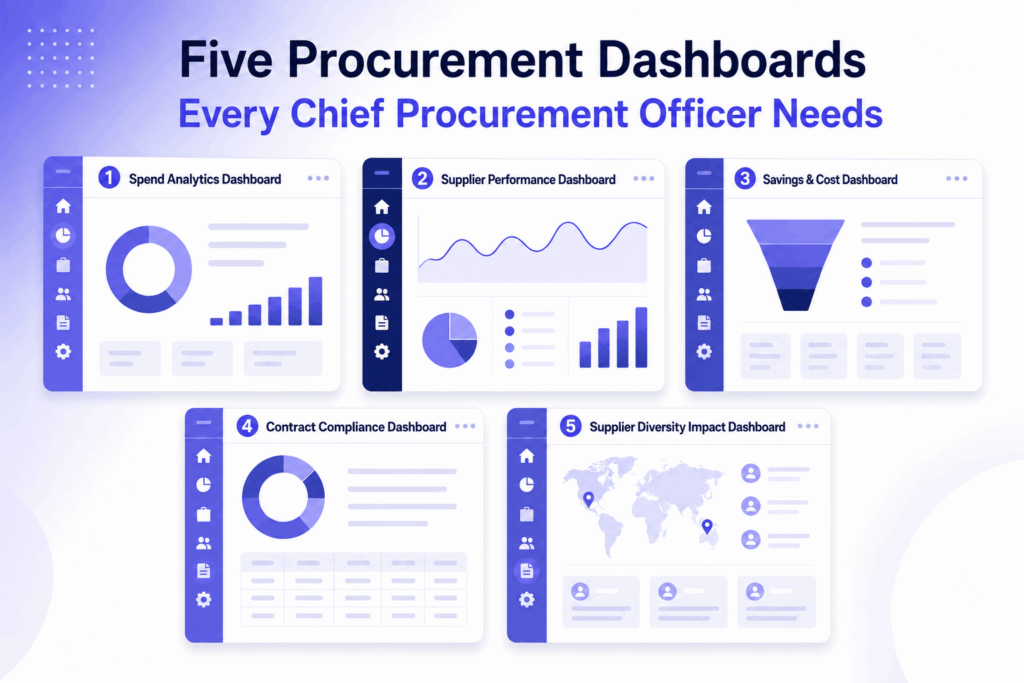
Procurement dashboards are visual reporting tools that consolidate spend, supplier, savings, contract, and diversity data into one real-time view. Every Chief Procurement Officer needs five core dashboards: spend analytics, supplier performance, savings and cost, contract compliance, and supplier diversity impact.
Key Takeaways
- A procurement analytics dashboard converts raw purchasing data into real-time visual insight.
- The five essential procurement dashboards cover spend analytics, supplier performance, savings, contract compliance, and supplier diversity impact.
- A spend analytics dashboard typically uncovers 3 to 10 percent in savings by exposing maverick and duplicate spend.
- Platforms like STARS by VIVA USA enable unlimited self-service procurement dashboards without IT support.
What Is a Procurement Analytics Dashboard?
A procurement analytics dashboard is defined as a centralized visual interface that aggregates purchasing data from ERP, contract, and supplier systems into charts, KPIs, and reports. It gives CPOs real-time visibility into spend, supplier performance, compliance, and savings, replacing static spreadsheets with interactive views.
The difference between procurement reporting and a procurement dashboard is timing and interactivity:
| Feature | Procurement Reporting | Procurement Analytics Dashboard |
|---|---|---|
| Frequency | Monthly or quarterly | Real time or near real time |
| Format | Static PDF or spreadsheet | Interactive charts and filters |
| Audience | Executives and auditors | CPOs, category managers, buyers |
| Action speed | Reactive | Proactive |
| Data scope | Snapshot | Continuous, drillable |
Why Do Chief Procurement Officers Need Procurement Dashboards?
CPOs need procurement dashboards because procurement now owns cost, risk, compliance, and ESG outcomes simultaneously. Dashboards surface anomalies such as maverick spend, supplier delays, or missed diversity goals within hours instead of quarters, so leaders act before small issues become budget or compliance failures.
- According to Deloitte (2023), high-performing procurement organizations were three to four times more likely than peers to have deployed advanced analytics capabilities.
- According to Businesswire (2024), 95 percent of procurement decision-makers said their organization has room to optimize procurement, and 98 percent planned investments in analytics, automation, or AI.
- According to McKinsey & Company (2023), companies that digitize procurement, including analytics and dashboards, can achieve annual savings of 3 to 10 percent of addressable spend.
What Makes an Effective Procurement Dashboard?
An effective procurement dashboard has five traits: clean and enriched data, role-based views, drill-down capability, automated refresh cycles, and export options. Dashboards built on unverified supplier data mislead decision-makers, so data cleansing and enrichment must come before visualization.
The Five Procurement Dashboards Every CPO Needs
Here are the top five procurement dashboards every Chief Procurement Officer needs: a spend analytics dashboard, a supplier performance dashboard, a savings and cost dashboard, a contract compliance dashboard, and a supplier diversity impact dashboard. Together they cover cost, quality, risk, compliance, and social value.
What Should a Spend Analytics Dashboard Include?
A spend analytics dashboard should include total spend by category, supplier, business unit, cost center, and geography, plus trend lines and year-over-year comparisons. It exposes maverick spend, duplicate suppliers, and consolidation opportunities through standard views like General Ledger and Commodities.
What Should a Supplier Performance Dashboard Track?
A supplier performance dashboard should track on-time delivery, quality and defect rates, responsiveness, contract adherence, ESG scores, and risk indicators. Best practice is scorecarding suppliers on weighted KPIs, reviewed quarterly or annually, so managers can reward top performers and flag risks before renewals.
How Doesa Savingsand Cost Dashboard Work?
A savings and cost dashboard works by comparing negotiated prices, realized savings, and cost avoidance against baseline spend and annual targets. It separates hard savings from soft savings and ties results to specific sourcing events, giving the CPO defensible numbers for CFO and board reporting.
Why Do CPOs Need a Contract Compliance Dashboard?
CPOs need a contract compliance dashboard because negotiated value leaks when purchases bypass agreed terms. This dashboard maps primes and subcontractors to contracts, tracks payments against goals set at the pre-bid stage, monitors submission deadlines, and simplifies audits across departments and agencies.
What Is a Supplier Diversity Impact Dashboard?
A supplier diversity impact dashboard tracks Tier 1 and Tier 2 diverse spend, certification status, goal attainment, and economic impact such as jobs supported and tax contributions. It supports federal Individual Subcontract Reports, corporate ESG disclosures, and state-level impact heat maps.
How STARS Builds Procurement Dashboards for CPOs
STARS, the supplier success platform from VIVA USA, helps CPOs create all five procurement dashboards through its no-code Reports Builder, which supports unlimited self-service reports with built-in visualizations. Used by Fortune 500 companies and government entities, STARS has analyzed over 10 billion dollars in spend.
How Does the STARS Reports Builder Create Dashboards Without IT Support?
The STARS Reports Builder creates dashboards without IT support through a drag-and-drop interface where business users select fields, apply filters, and generate charts, graphs, and exportable views. There is no cap on report volume, and analyst-built custom reports handle complex needs.
How Does STARS Power Each of the Five Dashboards?
STARS supplies a purpose-built module behind each dashboard:
- Spend analytics: The Tier 1 Supplier and Spend Analytics Module centralizes 50,000 to over 1 million spend records with 10 standard views.
- Supplier performance: Supplier Scorecarding evaluates vendors on up to 200 customizable KPIs across delivery, quality, ESG, and compliance.
- Savings and goals: Configurable goal setting and benchmarking reports measure results year over year and against industry peers.
- Contract compliance: The Contract Compliance Module maps primes and subcontractors to contracts, verifies payments, and tracks goal compliance.
- Diversity impact: Tier 2 Spend Reporting collects data from up to 300 prime suppliers, while Economic Impact Reports quantify jobs, income, and tax impact across 20 diversity categories.
STARS also strengthens accuracy with AI-powered data cleansing and enrichment reaching 98 percent plus accuracy at the Platinum tier, and it integrates with Ariba, Coupa, Oracle, SAP, and other ERP systems.
Conclusion
Three points matter most. First, procurement dashboards replace static reporting with real-time, decision-ready insight. Second, every CPO needs five views: spend analytics, supplier performance, savings, contract compliance, and diversity impact. Third, platforms like STARS make unlimited procurement dashboards achievable without IT support. Contact STARS for any supplier diversity related needs.
Help Center
Frequently asked questions

Marketing professional passionate about people, creativity, and meaningful growth. Proud to be part of the STARS team, empowering businesses to discover and manage diverse suppliers through one powerful platform.